
|


Tracing and the missing client debug log in Silverlight |
Post Reply 
|
| Author |
 Printable Version Printable Version Delicious Delicious Digg Digg Facebook Facebook Furl Furl Google Boomarks Google Boomarks Google Buzz Google Buzz MySpace MySpace Newsvine Newsvine reddit reddit StumbleUpon Translate StumbleUpon Translate Twitter Twitter Windows Live Windows Live Yahoo Bookmarks Yahoo Bookmarks Topic Search Topic Search  Topic Options Topic Options
|
WardBell 
IdeaBlade 

Joined: 31-Mar-2009 Location: Emeryville, CA, Posts: 338 |
 Post Options Post Options
 Quote Reply Quote Reply
 Topic: Tracing and the missing client debug log in Silverlight Topic: Tracing and the missing client debug log in SilverlightPosted: 03-Sep-2009 at 4:56pm |
|
uploads/482/TraceWindow.zip
You've probably discovered that we don't publish a debug log on the Silverlight client (we still publish the debug log on the server side by default). There's a great reason: you're not allowed to write to the file system in Silverlight ... except for Isolated Storage ... and you don't want to blow out IsoStore with log data. Wouldn't it be convenient to be able to log client activity and see it in
Silverlight during development? Maybe batch capture it and ship up a batch of messages to
the server periodically?
It's easier than you might think. Here's a code snippet to do the job:
private
void SubscribeToTracePublisher()
{ _messages = new ObservableCollection<TraceMessage>(); _subscriber = new TraceSubscriber(); _subscriber.Publish +=
NotificationHandler;
_subscriber.StartSubscription(); // Stuff } private
void NotificationHandler(object sender, PublishEventArgs e) {
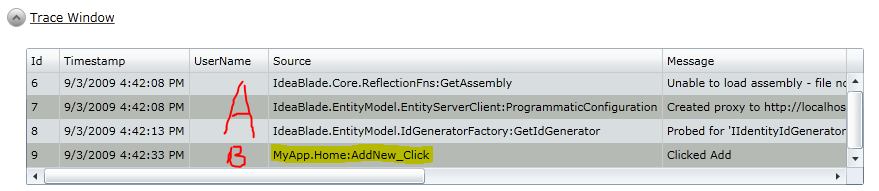
_messages.Add(e.TraceMessage); // Stuff } } The DevForce TracePublisher is "waiting" for your call. We hide most of the hook up. When you wire your handler to the subcriber object's "Publish" event [terrible name], DevForce attaches it to the TracePublisher and _now_ the publisher starts publishing (it won't if no one is listening). I've attached an example UserControl called TraceWindow that shows this in context. I drop it into my application view with a little XAML like this: <local:TraceWindow Height="200" Width="900" Margin="0,0,20,0"/> When I run the app, I'll see an expander button. I click that to open and I get this:
But notice "B". That's the method that recorded something to the trace log. The message "Clicked Add" was what I said when I posted a trace message. In this example, I've tied into the Add button handler like so: private void AddNew_Click(object sender, RoutedEventArgs e) { IdeaBlade.Core.TraceFns.WriteLine("Clicked Add"); // more stuff } You may choose to use DebugFns instead if you don't want to see messages in Release Mode. Or you can wrap the code in compiler directives to yank the whole business out of your production version. I'm sure you can get more creative. Enjoy! Edited by WardBell - 03-Sep-2009 at 5:15pm |
|
 |
|
|
antalakas
Newbie 

Joined: 25-Jun-2007 Location: Greece Posts: 28 |
Post Options
Quote Reply
Posted: 07-Sep-2009 at 8:13am |
|
Hello Ward,
I checked your code, NotificationHandler works ok, but my own trace (or debug) messages are not written in DebugLog.xml. Is it possible? Thank you Andreas |
|
|
Andreas Ntalakas
|
|
|
|
|
kimj
IdeaBlade

Joined: 09-May-2007 Posts: 1391 |
Post Options
Quote Reply
Posted: 07-Sep-2009 at 9:25am |
|
This was not available until version 5.2.2, released last week. Any client-side TraceFns or DebugFns calls should be picked up by a subscriber, once the subscriber has started. Your server-side tracing messages will still be written to the server-side debuglog.xml by default.
|
|
|
|
|
antalakas
Newbie
Joined: 25-Jun-2007 Location: Greece Posts: 28 |
Post Options
Quote Reply
Posted: 07-Sep-2009 at 11:18am |
|
I understand what you are saying and this is how i use it in WinClient and Classic. But nothing is written in the Debuglog.xml in Silverlight. I am asking if there is a global flag that turns this feature off that i have not noticed, in my application.
thank you A |
|
|
Andreas Ntalakas
|
|
|
|
|
kimj
IdeaBlade
Joined: 09-May-2007 Posts: 1391 |
Post Options
Quote Reply
Posted: 07-Sep-2009 at 7:09pm |
|
There is no debuglog.xml on the client side of a Silverlight application, unless you use the TraceSubscriber shown in the original post to write your own. This means that the <logFile> element in a Silverlight app.config file is ignored.
Are you saying that you're using the TraceSubscriber to write a log file to IsoStore, but that nothing is written? If so, either the tracing messages were published before the TraceSubscriber started, or the TraceSubscriber isn't actually subscribed. There are no flag settings which control this. For the record, I'll just emphasize that tracing messages from the client are not written to the debuglog.xml on the server, and likewise trace messages generated on the server are not received by any client side subscriber. A unified log file for all messages from either side of a Silverlight application would be very nice to have, but we haven't put that in place yet. |
|
|
|
|
antalakas
Newbie
Joined: 25-Jun-2007 Location: Greece Posts: 28 |
Post Options
Quote Reply
Posted: 08-Sep-2009 at 12:51am |
|
kimj wrote:
"For the record, I'll just emphasize that tracing messages from the client are not written to the debuglog.xml on the server, and likewise trace messages generated on the server are not received by any client side subscriber. A unified log file for all messages from either side of a Silverlight application would be very nice to have, but we haven't put that in place yet." It is clear to me now. I was expecting client side generated messages to show on the server debug log. It will be a nice feature to have. Thank you Andreas |
|
|
Andreas Ntalakas
|
|
|
|
|
antalakas
Newbie
Joined: 25-Jun-2007 Location: Greece Posts: 28 |
Post Options
Quote Reply
Posted: 08-Sep-2009 at 5:11am |
|
It was easy. I created a WCF service hosted in the IIS project, and forwarded all messages captured by NotificationHandler to it. Then used TraceFnc.WriteLine to log client messages to server side DebugLog. Someone could set aspNetCompatibilityEnabled to true in web.config to be able to log client side ip, and client hostname using dns resolution.
A |
|
|
Andreas Ntalakas
|
|
|
|
|
WardBell
IdeaBlade
Joined: 31-Mar-2009 Location: Emeryville, CA, Posts: 338 |
Post Options
Quote Reply
Posted: 08-Sep-2009 at 9:04am |
|
Andreas - There is an even easier way to do this ... one that I put in place for a customer. I leveraged the EntityManager.InvokeServerMethod feature that makes it easy to call a custom method executing on the server and pass it data over the same pipeline used for persistence operations.
Imagine a static class called ServerLogger with a single Log method that takes a message. All it does is take the message and user identity (always given to a server-method) and calls TraceFns.WriteLine. As this is called on the server, the message goes into the server debug log.
On the client I provided a LoggingService that wraps access to the client-side TraceFns (perhaps much like your NotificationHandler). Messages sent to the LoggingService are routed to the server via InvokeServerMethod.
It was just a few lines of code on each side and took maybe an hour to write and test. Notice that there is no configuration or service hosting required.
Someday, when I have multiple middle-tier BOS instances, I might want to consolidate the logs into one. I'll probably put it in the database. Easy to do because my LoggingService is also given an EntityManager to work with.
I should just put this code sample in the Forum. Maybe if someone asks for it :-)
|
|
|
|
|
antalakas
Newbie
Joined: 25-Jun-2007 Location: Greece Posts: 28 |
Post Options
Quote Reply
Posted: 10-Sep-2009 at 9:18am |
|
Ward, you are right. This is the Devforce way. I understand the concept and i could write the code but if you decide to publish yours i will be the first to use it. After all, who says no to ready-to-integrate code?
Thank you Andreas |
|
|
Andreas Ntalakas
|
|
|
|
|
skingaby
DevForce MVP 

Joined: 23-Apr-2008 Location: United States Posts: 146 |
Post Options
Quote Reply
Posted: 17-Sep-2009 at 7:42pm |
|
The server side log seems to write down a lot of messages about what it is doing, while the client side is much less communicative. I am using the AsyncSerial and AsyncParallelTasks (which are great, by the way, for keeping my long chains of async behaviors somewhat more manageable), and I would love to be able to look at the server side and client side of these conversations and see what is happening in each place and when. For example, I have an AsyncParallel task that launches a bunch of query operations to fill a bunch of filter combos at the top of a grid form. Each query has a callback that turns the result into an IList (more or less) for the combo. I would like to see what Ideablade is doing with the client-side cache when it does a DataSourceAndCache query to see if I am making redundant calls to the server when the list items are already cached. Thanks.
|
|
|
|
|
WardBell
IdeaBlade
Joined: 31-Mar-2009 Location: Emeryville, CA, Posts: 338 |
Post Options
Quote Reply
Posted: 17-Sep-2009 at 9:59pm |
|
@skingaby - Your observation is correct. DevForce itself has very little to say on the client side; once it has acquired the middle tier, it pretty much goes quiet. DevForce on the server continues to chirp away about the requests it sees (and there is a verbose option that will show you the SQL too).
You may not have noticed that you can easily add your own trace messages on either side. Call TraceFns.WriteLine on the client and you'll see your message on the client (that's how "Clicked Add" appears in the example in my post). You can write to the server log from a method executing on the middle tier in just the same way.
I think this is clue enough to see how you could record your own messages on the client log if you wanted to trace moments in your AsyncTask processing. Just remember that there is no physical log on the client in Silverlight ... you'll have to view it in the UI itself as I've discussed here.
Or write the trace to the debug log on the server.
In my remarks to "Antalakas" I described an approach to sending messages from the client to the server where they could be interwoven with other server log messages.
I owe @Antalakas a code sample of using DevForce InvokeServerMethod to write to the debug log on the server ... and I'm posting it to the forum now.
--
Perhaps you want to distinguish between those queries that went to the server and those that did not? You don't have to use the log for this purpose. There are events that you could listen to ... and breakpoint ... if you prefer.
You'll also want to be careful not to blow out the server log with too many messages. Their fine during dev but you want to be careful in production.
If you don't know about the events and how to tell if the query stayed local or went to the server, we can discuss that topic elsewhere. Edited by WardBell - 18-Sep-2009 at 12:18am |
|
|
|
|
antalakas
Newbie
Joined: 25-Jun-2007 Location: Greece Posts: 28 |
Post Options
Quote Reply
Posted: 18-Sep-2009 at 12:48am |
|
Thank you Ward
A |
|
|
Andreas Ntalakas
|
|
|
|
|
skingaby
DevForce MVP
Joined: 23-Apr-2008 Location: United States Posts: 146 |
Post Options
Quote Reply
Posted: 18-Sep-2009 at 4:56am |
|
Yes please. Any help you can give with getting inside what is happening would be appreciated. What are those query events?
|
|
|
|
|
WardBell
IdeaBlade
Joined: 31-Mar-2009 Location: Emeryville, CA, Posts: 338 |
Post Options
Quote Reply
Posted: 18-Sep-2009 at 4:49pm |
|
I just wrote about it on the forum in "Query-related events on the Client"
|
|
|
|
|
skingaby
DevForce MVP
Joined: 23-Apr-2008 Location: United States Posts: 146 |
Post Options
Quote Reply
Posted: 21-Sep-2009 at 9:59am |
|
Thanks! This helps. I can see the calls now.
|
|
|
|
|
Post Reply
|
| Forum Jump | Forum Permissions You cannot post new topics in this forum You cannot reply to topics in this forum You cannot delete your posts in this forum You cannot edit your posts in this forum You cannot create polls in this forum You cannot vote in polls in this forum |